Nationally, the three most prominent residential real estate market trends are the ongoing lack of inventory, the steadily upward movement of home prices and year-over-year declines in home sales.
Those trends are for the most part true in Long Beach as well. The inventory of houses for sale in Long Beach for the past 12 month is 1.8% below the prior year, which was already low. There is currently about a two month supply of homes for sale in Long Beach, which is consistent with other local communities.
There were just 88 pending sales in Long Beach this February, 42.5% below the previous February. Closed sales were at 148, up from February 2017; however, the past 12 months of sales is 3.4% below the previous 12 months.
The sales declines are a natural result of there being fewer homes for sale, and higher prices often indicate higher demand leading to competitive bidding. Markets are poised for increased supply, so there is hope that more sellers will take advantage of a ready and willing buyer base.
Those who have chosen to list their homes have enjoyed a shorter time on market – 40 days average in February 2018 compared to 51 the previous year – as well as a higher percentage of original list price received – 98.2% in February 2018 compared to 97.2% in February 2017.
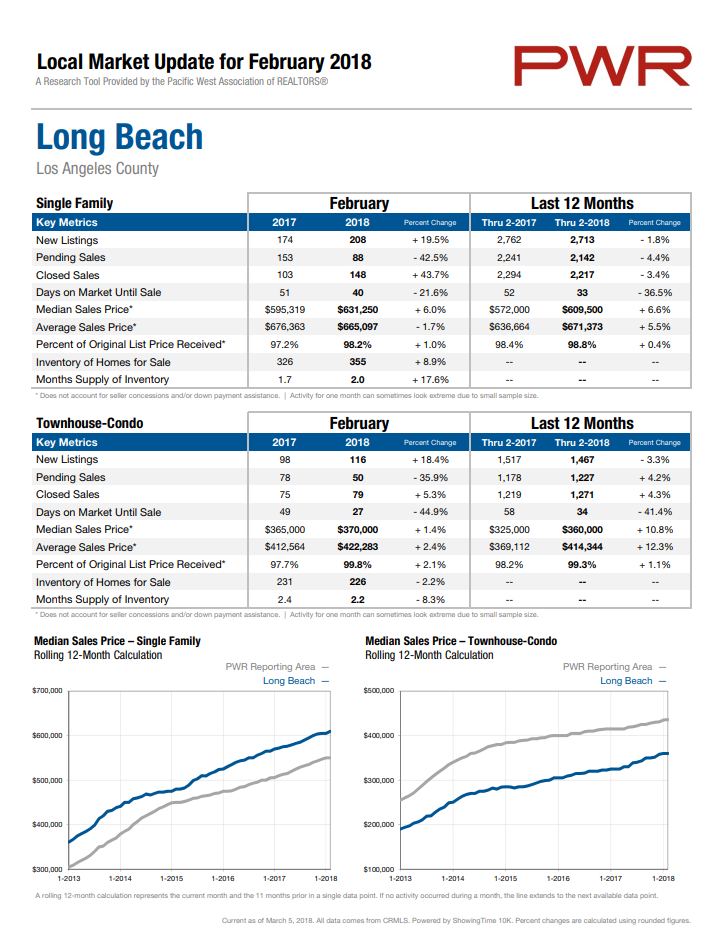
Local Market Statistics for Long Beach
Long Beach is a city made of up many diverse neighborhoods, with housing choices ranging from entry-level to luxury. The pricing, inventory, and market trends can vary widely from one neighborhood to the next. Here’s a look at the latest Long Beach real estate market trends by zip code.
90802
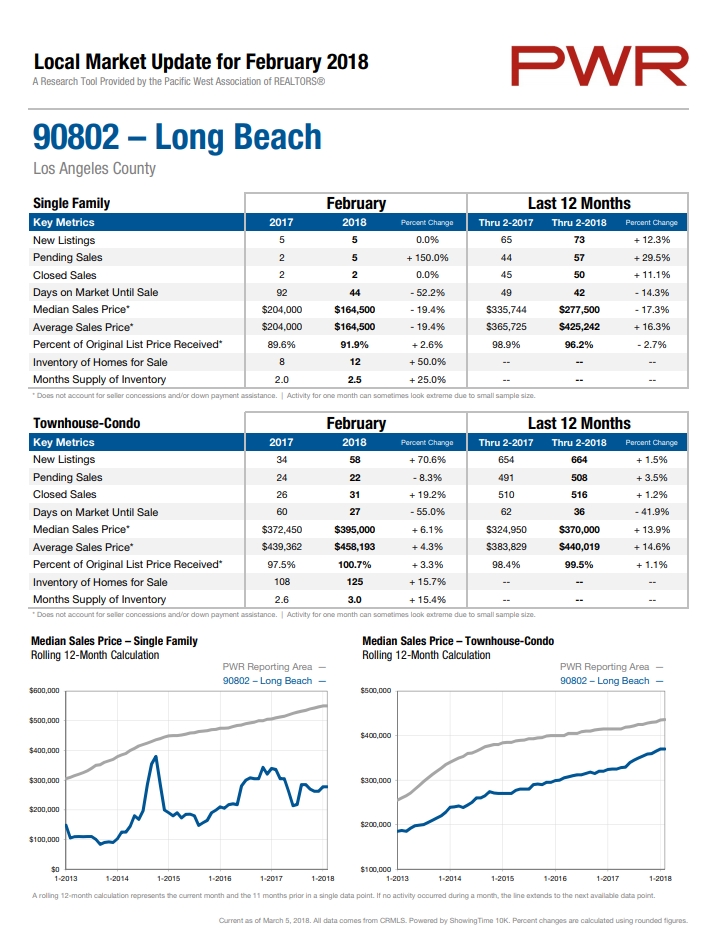
The 90802 area, which includes downtown Long Beach as well as Alamitos Beach, consists primarily of condos. Closed sales and new listings were both up for condos in 90802 in February 2018, as was the average sales price.
90803
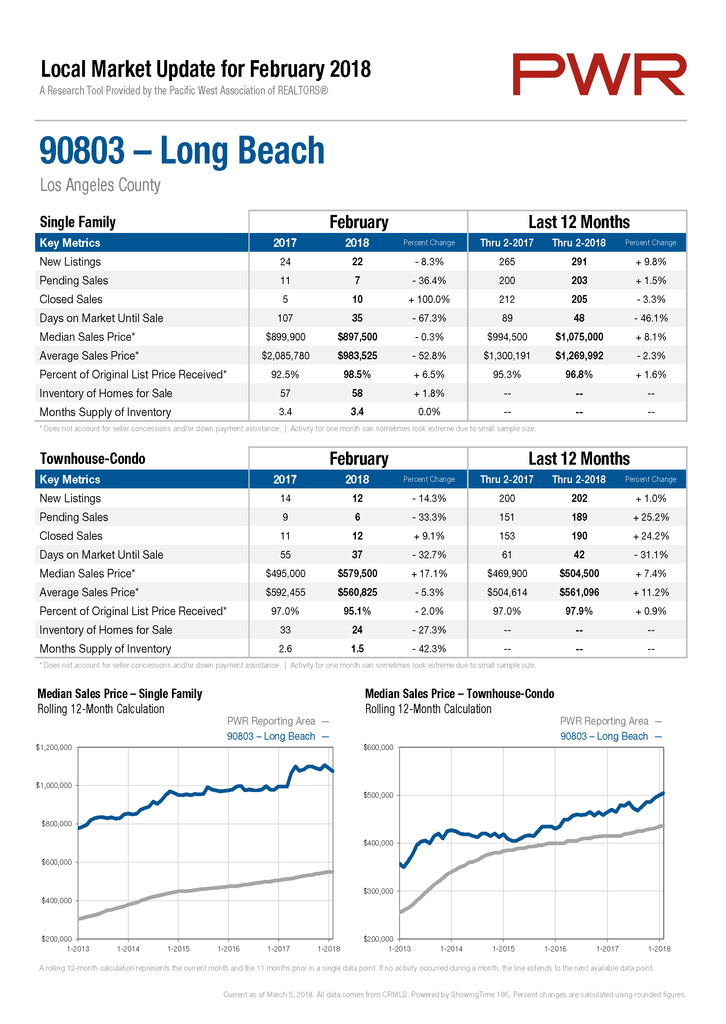
The 90803 area includes Belmont Shore and Naples, a portion of Belmont Heights, along with gated communities of Marina Pacifica, Del Lago, Bay Harbour, and Spinnaker Bay. While the median home price rose in Long Beach overall in February, it remained relatively flat in 90803. Still, for the rolling 12 months through 2018, the median sales price was up over the previous 12 month period. The inventory of homes for sale in 90803 remained consistent with last year but the time on market shortened considerably, from 107 days in February 2017 to just 35 days this year.
90804
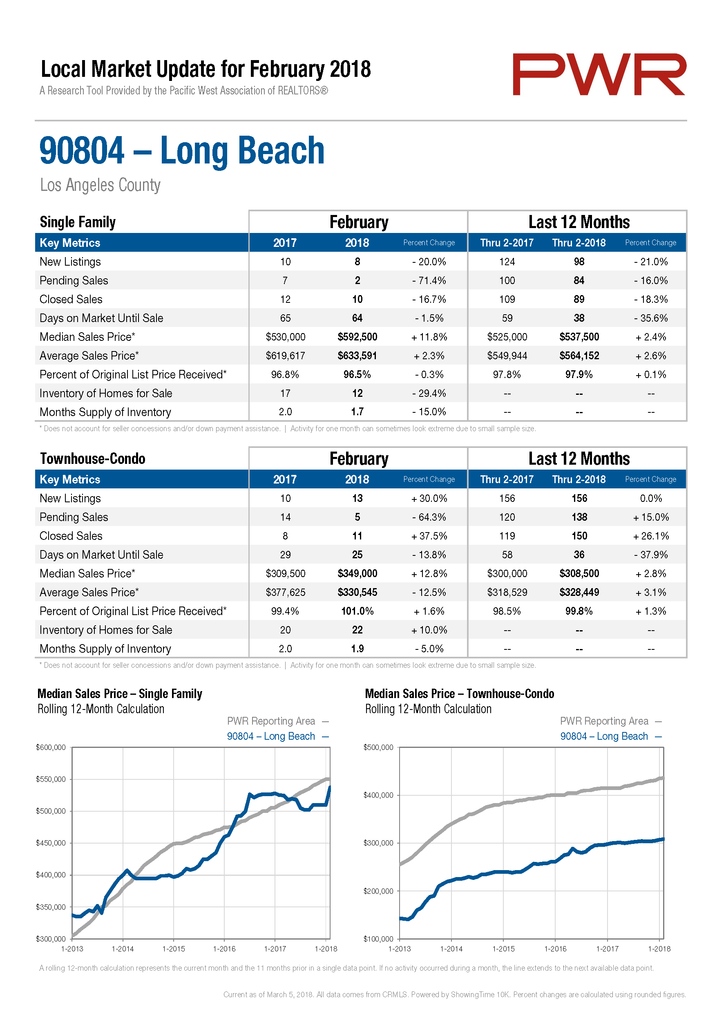
The 90804 area includes Rose Park, the Circle Area, and Zaferia neighborhoods. This is one of the areas of Long Beach where supply is not keeping pace with demand. New listings, pending sales, and closed sales were all down in February 2018, while the median home price went up and the supply of homes went down.
90805
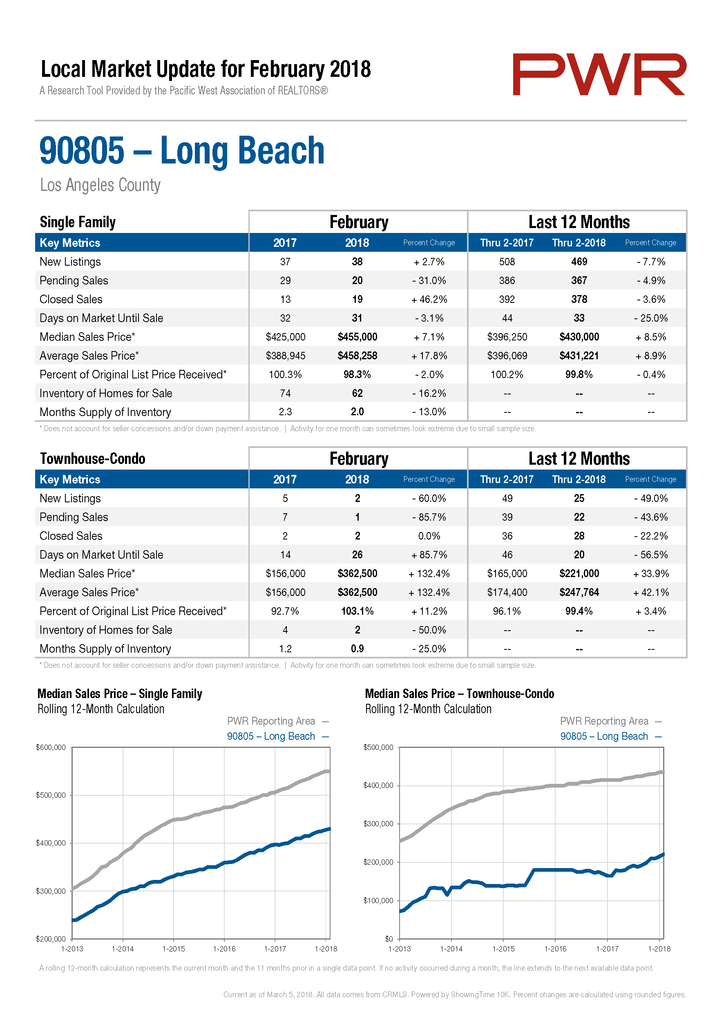
90805, which encompasses North Long Beach, saw an increase of 7.1% in the median sales price in February 2018, along with an increase in new listings and closed sales. There is currently a two month supply of homes for sale and the average time on the market is 31 days.
90806
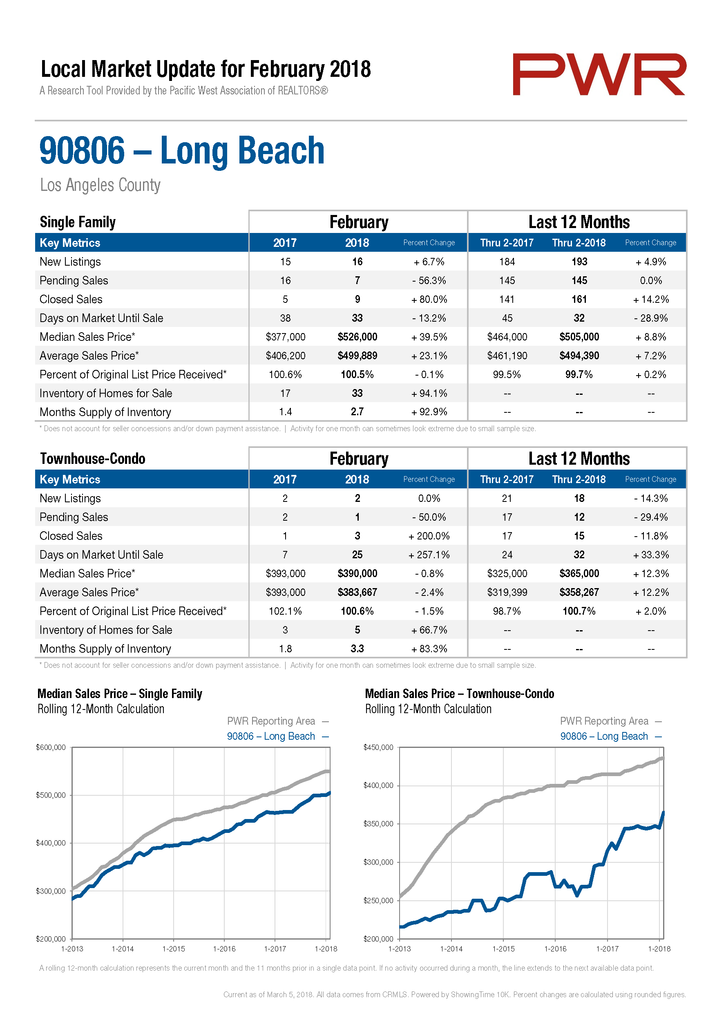
The median home price in 90806, which includes the Wrigley neighborhood, went up by 29.5% in February 2018, compared to the previous year and the percentage of list price to sales price remained at above 100%. Unlike much of Long Beach, new listings also went up, increasing the inventory of homes for sale in 90806 to a 2.7 month supply. Homes are selling relatively quickly, at an average of 33 days.
90807
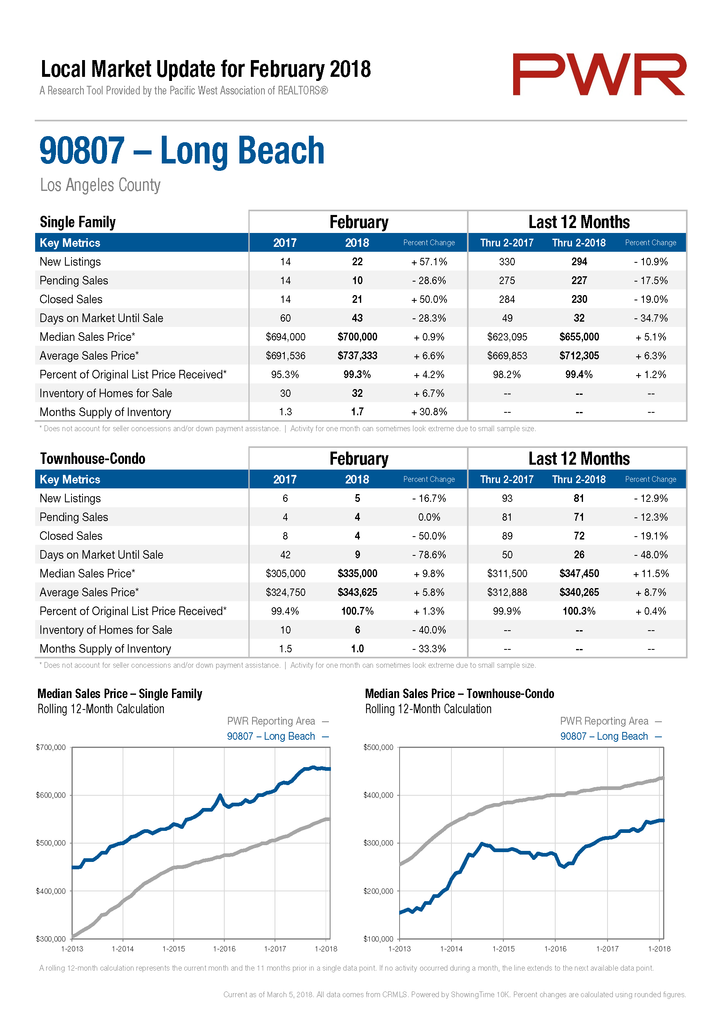
The 90807 neighborhood includes California Heights, Los Cerritos, Bixby Knolls, Virginia Country Club, Bixby Terrace, Bixby Highlands, Country Club Manor, and Ridgewood Heights. The median sales price in this area increased slightly to $700,000, while new listings and closed sales both increased. The average time to sell decreased to 43 days and the inventory of homes for sale increased slightly but remains low, at just a 1.7 month supply.
90808
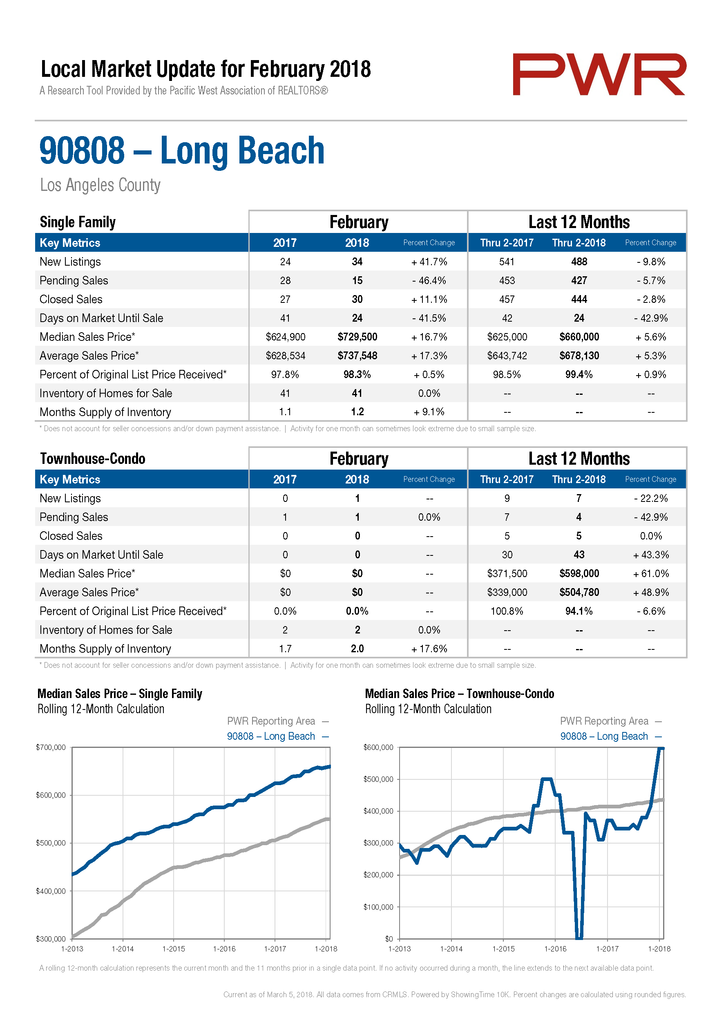
The 90808 zip code includes Lakewood Village, Carson Park, Old Lakewood City, South of Conant, the Cliff May Ranchos, and El Dorado Park Estates. The median sales price in 90808 was up by 16.7% in February 2018 compared to a year ago, while new listings and closed sales were also up. The average time on market was just 24 days, one of the shortest among Long Beach zip codes, and the inventory of homes for sale is at just a 1.2 month supply, among the lowest in Long Beach.
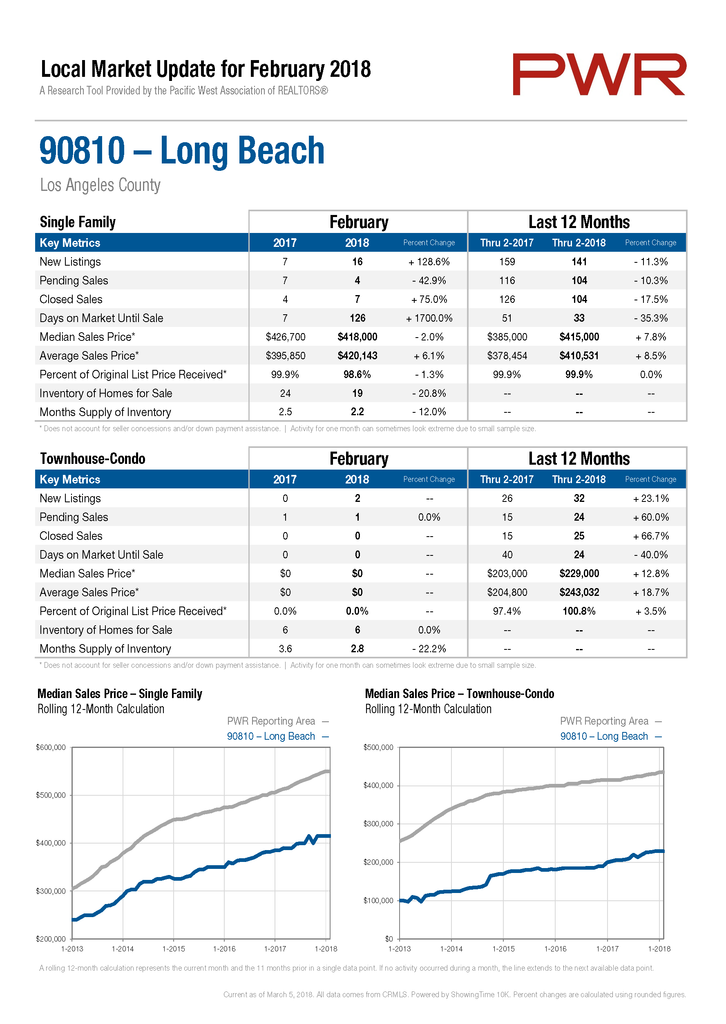
90810
New listings in 90810, West Long Beach, more than doubled in February 2018 compared to the previous year, while the time to sell a home went up by 1700%. Meanwhile, the median home price dipped slightly and the inventory of homes for sale declined to a 2.2 month supply.
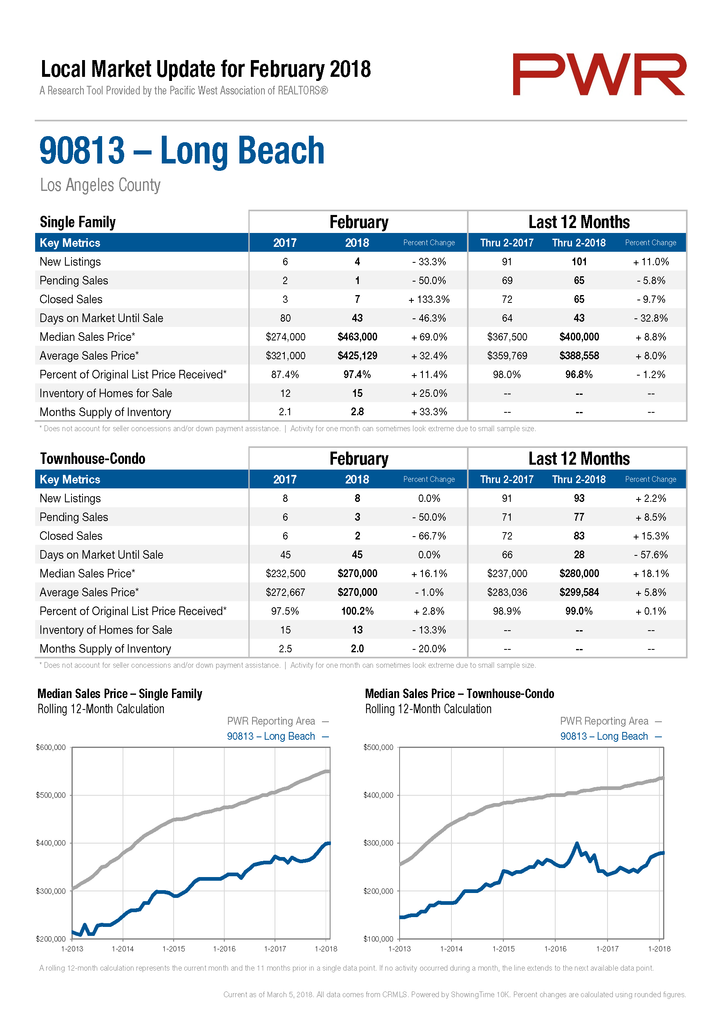
90813
90813 includes the Willmore, Washington, Cambodia Town, and Hellman Street neighborhoods. The median home price in 90813 went up by 69% in February compared to the previous year, while the median condo price went up by 16.1%. Days on market shortened to 43 days for homes, and there’s currently a 2.8 month supply.
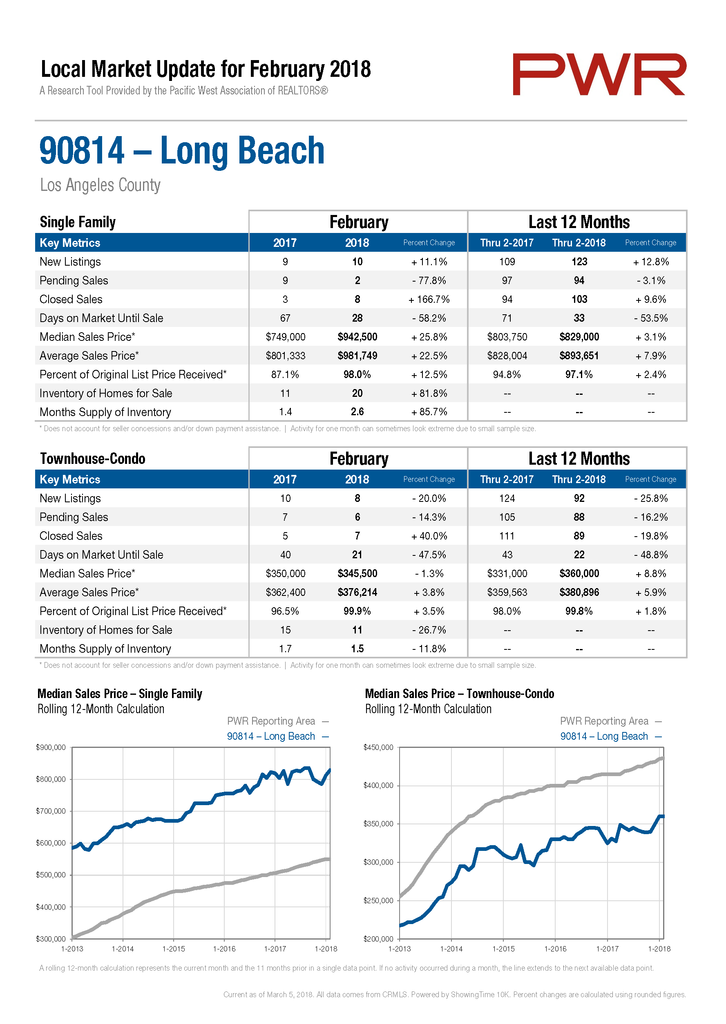
90814
The 90814 neighborhood includes Rose Park South, Carroll Park, portions of Bluff Heights and Belmont Heights, along with Alamitos Heights. This area saw the median home price jump by 25.8% between February 2017 and February 2018, rising to $942,500. The percentage of list price to sales price climbed from 87.1% to 98% and time on market dropped from 67 days to just 28 days. Currently there is a 2.6 month supply of homes for sale in 90814.
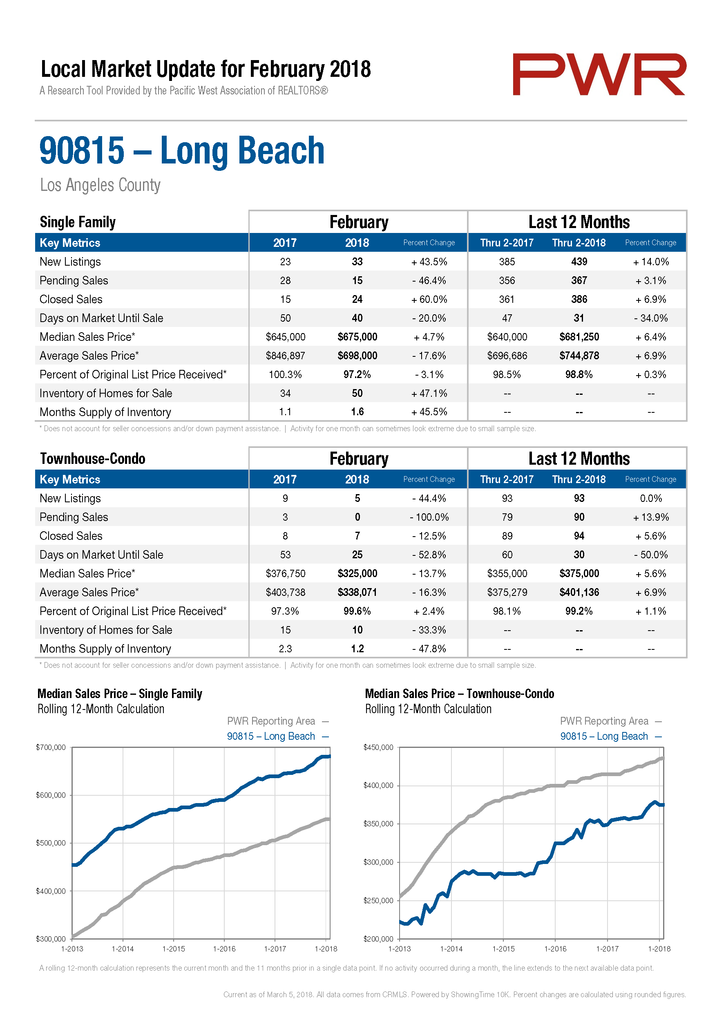
90815
The 90815 neighborhood includes Los Altos, La Marina Estates, Park Estates, Artcraft Manor, El Dorado south, and the Plaza. This area continues to have one of the city’s lowest inventory of homes for sale, with just a 1.6 month supply. The median home price in 90815 rose by 4.7% in February 2018, compared to a year ago, and the average time to sell a home declined by 20%.
Local Market Statistics for Lakewood
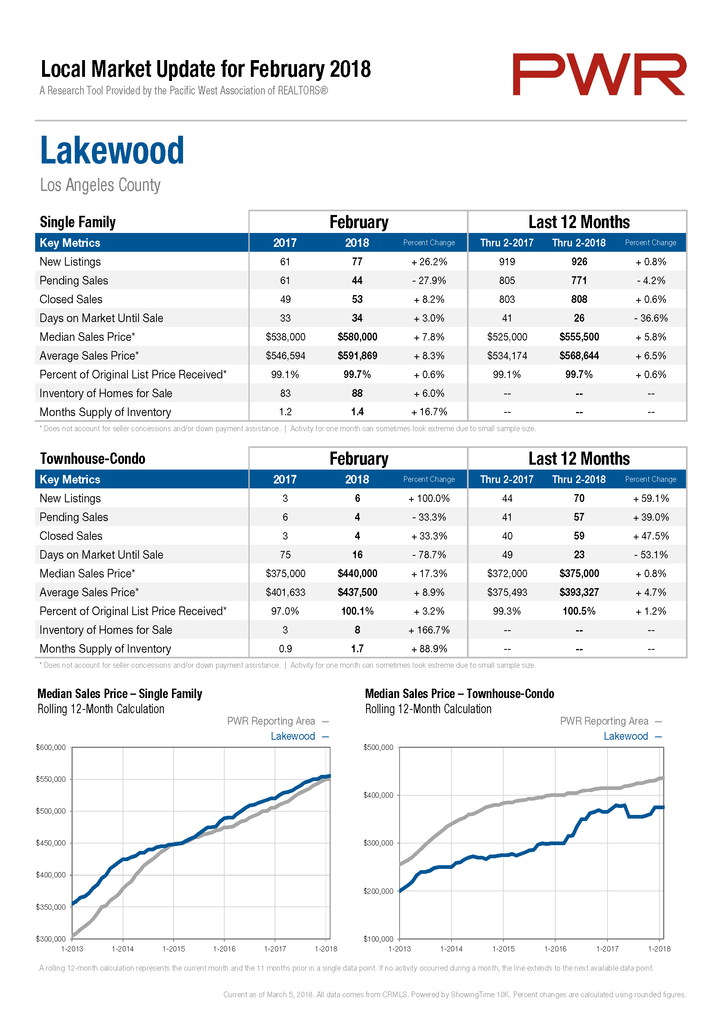
The Lakewood real estate market is very hot right now, with just a 1.4 month supply of homes for sale an an average selling time of 34 days. The median home price in Lakewood rose by 7.8% in February 2018, compared to the previous year.
Local Market Statistics for Seal Beach
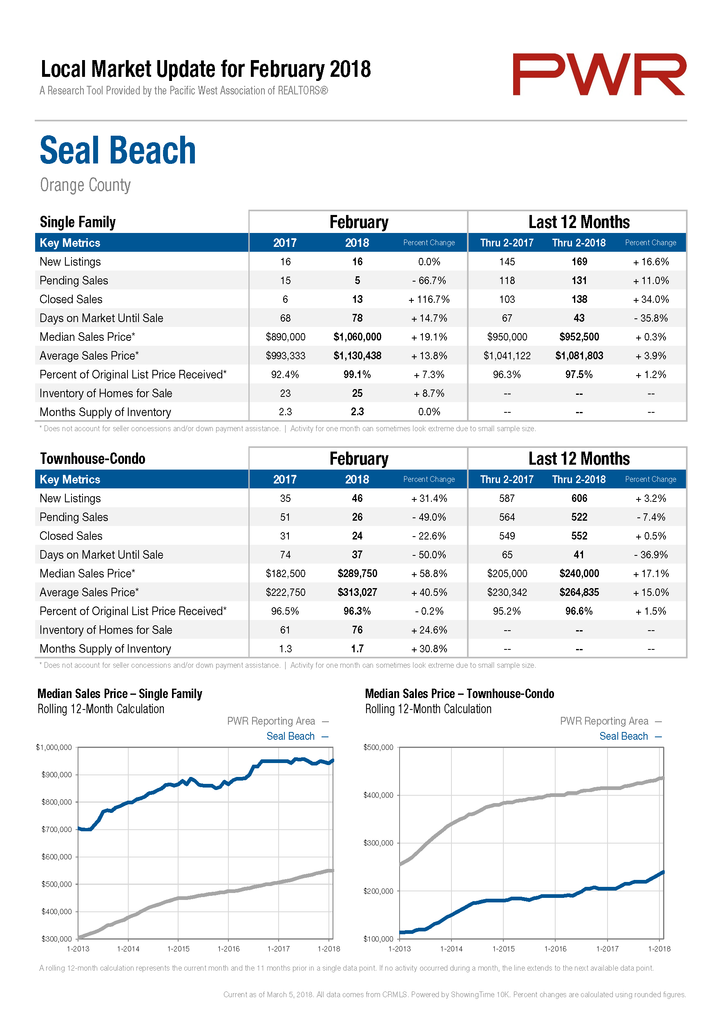
The median home price in Seal Beach increased by 19.1% in February 2018, as compared to the previous February. Meanwhile, the number of closed sales more than doubled from the previous February, and the percentage of original list price received increased by 7.3%.
Local Market Statistics for Los Alamitos
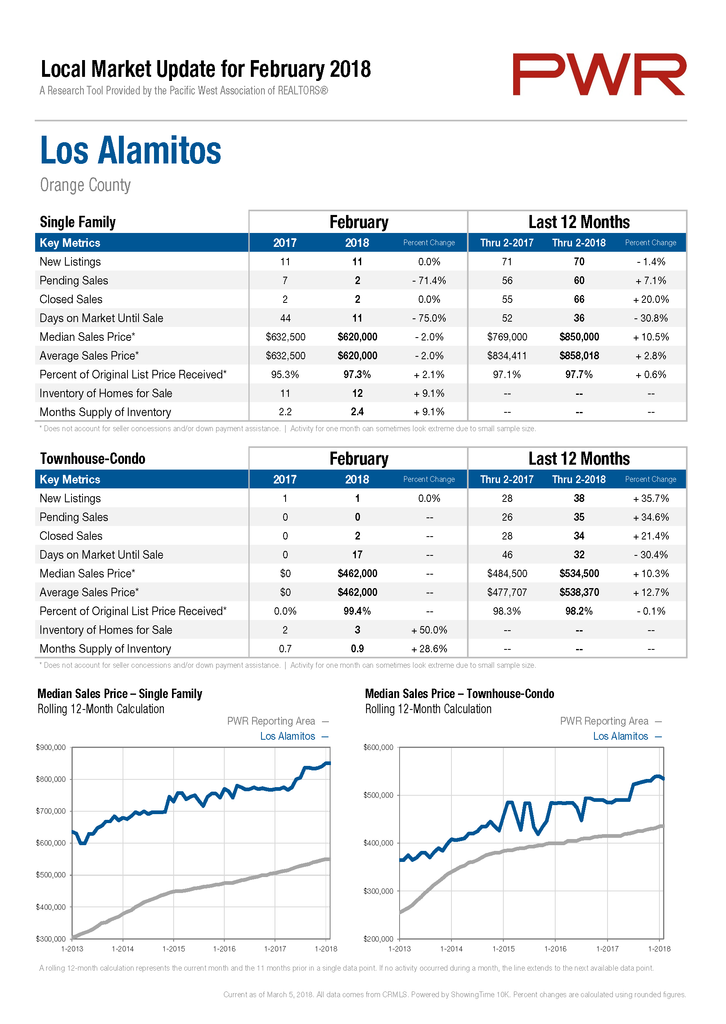
Home prices in Los Alamitos showed a 2% decline in February 2018 compared to the previous year, but there were just two homes that closed, and the 12 month rolling price is actually up by 10.5%. The current inventory of homes for sale is at just a 2.4 month supply.
Local Market Statistics for Signal Hill
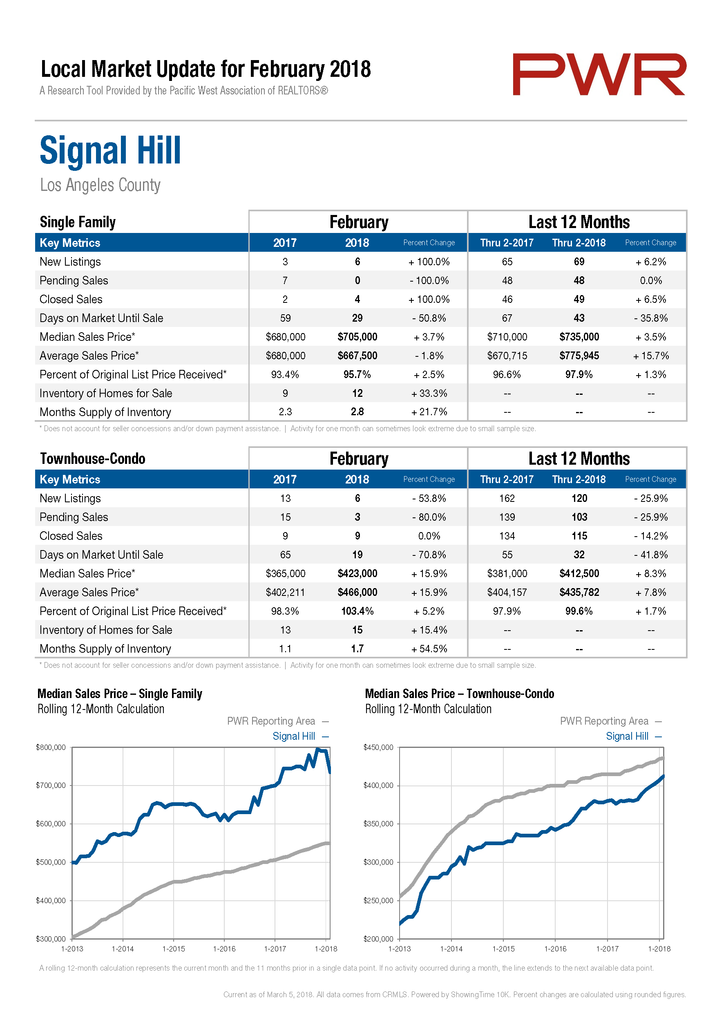
Home prices in Signal Hill increased by 3.7% in February 2018 compared to the previous February, while median condo prices posted a 15.9% increase during the same time period. Both homes and condos are selling quickly in Signal Hill, at an average of 29 days for houses and 19 days for condos.
What Does This Mean For Your Home?
Individual home values are a function of condition, location, area and the supply and demand in any given neighborhood. From city to city, and from neighborhood to neighborhood, markets can vary greatly. If you’d like a current evaluation of your home, please fill out the contact form below and we’d be happy to provide you with a custom report.


Leave a Reply